
Functional Stock Analysis (FunStock)
![]()
Introduction
The target is to evaluate if a language (domain specific) for stock market analysis can be designed to make it both powerful and simple to use for most users.
Inspiration comes from:
I had a few ideas when I started evaluating this topic:
- Make the language mathematical/functional rather than imperative
- Do operations on time series (as a whole) not on individual data points at a specific time
- Harmonize between indicators (line diagrams) and signals (buy/sell events)
Status
At present it's a simple proof of concept. A set of data structures and functions has been defined in Haskell which allow simple analysis to be performed.
The following features are supported.
- A time series datatype has been defined to hold stock data, indicators and signals (
TimeSeries.hs) - A set of general functions operating on time series has been defined (
TimeSeries.hs) - A set of example indicators has been defined which is based on basic functionality of time series (
StockIndicators.hs) - Stock data can be downloaded from google finance (
StockIo.hs) - Simple diagrams can be generated as SVG (
StockView.hs)
There are still a lot more to do to make this useful or complete. For instance.
- Scripts are plain Haskell code which need to be compiled (not usable by most users)
- Diagramming features are very limited
- It's a command line tool which generates a single SVG file (no UI)
But it has somewhat helped me to further understand how to design a stock analysis language.
An example
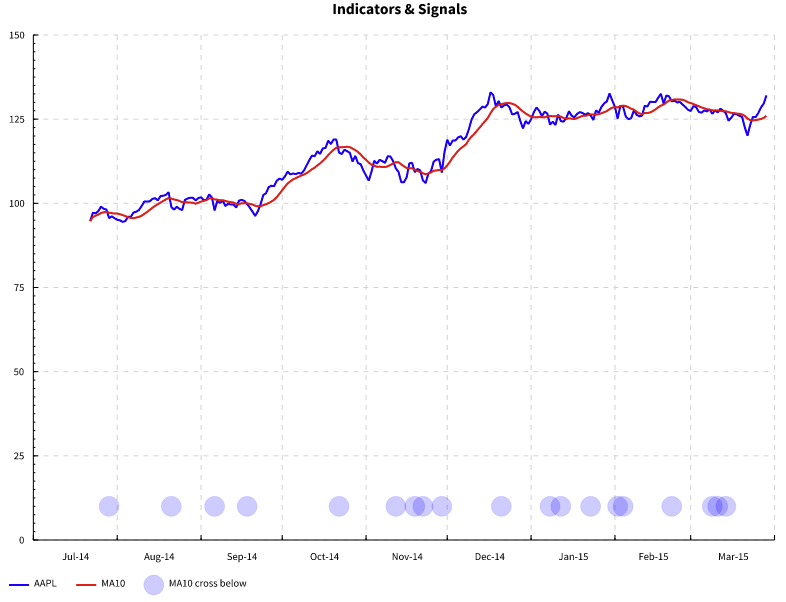
An example diagram is generated by FunStock.hs.
It does the following.
- Load share stock data from a file (
stocks/aapl.csv) as time series - Calculates a 10 step moving average as an indicator
- Defines a signal which trigger when MA10 indicator passes below stock indicator
- Draws a diagram with the two indicators and the signal
The code is shown below.
main =
  do
    s <- loadShareFile "aapl"
    let aapl = select Io.Close s
    let ma10 = movingAvarage 10 aapl
    let cross = crossesBelow ma10 aapl
    let indicators = [ ("AAPL", opaque blue, aapl)
                     , ("MA10", opaque red, ma10)
                     ]
    let signals = [ ("MA10 cross below", cross) ]
    draw "aapl.svg" indicators signals
The Haskell code is quite straight forward. It could be made even easier to read if a domain specific language were used, which more or less directly could map towards the Haskell implementation.
In such case the syntax could look like the following.
aapl = stock("aapl").close
ma10 = movingAvarage(10, aapl)
cross = crossesBelow(ma10, aapl)
indicators = [ ("AAPL", blue, aapl), ("MA10", red, ma10) ]
signals = [ ("MA10 cross below", cross) ]
draw "aapl.svg" indicators signals
The idea is that it shall be relatively simple to extend with new functions like movingAvarage and crossesBelow.
For instance movingAvarage (in StockIndicators.hs) is quite simple.
mean :: (Floating a) => [a] -> a
mean xs = sum xs / len xs

-- Calculate moving average for a time series over n number of data points
movingAvarage :: (Floating a) => Int -> TimeSeries a -> TimeSeries a
movingAvarage n ts = TS.map mean $ slidingWindow n ts
It makes use of slidingWindow (in TimeSeries.hs) which convert a single valued time series to a multi valued time series of a specified window length.
movingAvarage is done two steps.
First, the time series is fed through the slidingWindow function.
slidingWindow n ts
Then the mean function is "mapped over" the "windowed" time series.
TS.map mean $ ...
It turns out that most simple indicators (i.e. indicators that only depend on "current" value) can be implemented through a simple map function.
-- Map for time series
map :: (a -> b) -> (TimeSeries a) -> (TimeSeries b)
map f ts@(TS _ _ as) = ts { series = P.map f as } where
For instance aapl + 10 would be written as.
aaplPlus10 = TS.map (+10) aapl
Many indicators are however stateful i.e. they are dependent on previous data in the time series.
For instance in slidingWindow the "current" value is a list of the previous N values. This is a typical stateful operation.
-- Make sliding window from time series. Use a fifo as state
slidingWindow :: Int -> TimeSeries a -> TimeSeries [a]
slidingWindow n ts = smap window s0 ts where
  s0 = F.mkEmpty n
  window s e = let s' = push s e in (s', F.toList s')
To do stateful map operation there is a special smap (in TimeSeries.hs) which keeps a custom state through the map.
-- Stateful map functions for time series. It runs through series from chronologically, while
-- keeping a state through the process. Map function :: state -> elem -> (state', elem')
smap :: (s -> a -> (s, b)) -> s -> TimeSeries a -> TimeSeries b
smap f s0 ts@(TS _ _ as) = ts { series = as' } where
  as' = reverse $ snd $ foldl smap' (s0, []) as
  smap' (s, es') e = let (s', e') = f s e in (s', e':es')
smap is similar to map but it also permit a state to "travel" through the map.
To implement slidingWindow we make use of a FIFO queue, to keep a list of the most N recent values of the input, as the state in the stateful map operation.
crossesBelow (in StockIndicators.hs) use a different strategy.
-- Determine when time series a cross from below of b from previous value to current
crossesBelow :: (Num a, Ord a) => TimeSeries a -> TimeSeries a -> Signal
crossesBelow a b = mkSignal id s where
  a' = combine (,) (TS.delay 1 a) a
  b' = combine (,) (TS.delay 1 b) b
  s = combine crossBelow a' b'
  -- Does (a_prev,a) pass (b_prev,b) from below i.e. is a_prev < b_prev && a > b ?
  crossBelow :: (Num a, Ord a) => (a,a) -> (a,a) -> Bool
  crossBelow (a',a) (b',b) | a' < b' && a > b = True
                           | otherwise        = False
To determine if one time series passes another time series at a specified time instant (t) you need to look at the current value as well as the previous value. You could do this by keeping the previous value as state in a stateful map operation, but here we use a different strategy.
Instead, we take each time series and "combines" it with a delayed (one time step) version of itself. combine (in TimeSeries.hs) takes two time series and combines its values by a supplied function. In this case we make a "tuple" from the two time series which creates a new time series with both current and previous value (a_prev,a) as its tuple values.
crossBelow is a pure function that takes two tuples (from series a and b) at current and previous time ((a_prev,a) and (b_prev,b)) to determine if a passed b from previous time step.
Finally crossBelow is combined with the "tupled" time series to create a time series with Bool values. mkSignal convert a time series to a signal using a conversion function. The conversion function is in this case the identity function id as the time series alread have the final Bool values.
The resulting SVG diagram is shown below.
The complete code
The whole code for the proof of concept can be found here.
funstock.tgz - All source code
Rough sketch of underlying structure
Pure functions
on single values
f :: a -> b

+1
/2
on multiple values
f :: a -> b -> c

a > b
a - b
on list of values
f :: [a] -> b

sum a
max a
Time Series and Signals
a is Floating
TimeSeries a
a is Bool or ADT
Signal a
Both TimeSeries and Signal should implement Functor and Applicative, but not Monad
Functions on single time series (Functor)
fmap :: (a -> b) -> TimeSeries a -> TimeSeries b (Functor)
Stateful fmap i.e. keep a state through fmap operation
smap :: (a -> b -> (b, c)) -> c -> TimeSeries a -> TimeSeries c
Combinations of time series (Applicative)
f (a -> b) -> f a -> f b

combine :: (a -> b -> c) -> [TimeSeries a] -> TimeSeries [b] -> TimeSeries [c]
merge :: [TimeSeries a] -> TimeSeries [a]
Convolution and reordering of time series
delay :: Int -> b -> TimeSeries a -> TimeSeries b
windowed :: Int -> a -> TimeSeries a -> TimeSeries [a]

reordering ???
Combinations of Time series and Signals
f :: (a -> b) -> TimeSeries a -> Signal b
g :: (a -> b) -> Signal a -> TimeSeries b
Evaluate auto package as alternative
Evaluate auto package.TBD.
Platform idea
Enable a platform where pure scripts with very strictly defined and typed inputs and outputs can be easily uploaded updated and shared between different scripts.
- Compare with AWS lamda functions for defining new processing tools for displaying stock data
- Allow a viewer to show any stock input source with a compatible function
The platform is partly openly available as a default. But subscription with increased access can be bought.
For fast viewing SVG could be processed progressively on the backend and fast scrolling could be enabled on the front end without any server interaction. See e.g. ChartIQ
FunStock
These ideas was also tested in an online technical analysis tool FunStock.
It is currenlty quite limited due to limitations from stock data source providers.
References
- TradingView - a quite advanced trading platform
- d3.js - javascript diagramming framework
- TechanJS - TA built on d3
- The Essence of Dataflow Programming
- APEX Charts - MIT licensed
- ContEx - Server side rendering in Elixir
- HighCharts - Used by Avanza